FINDINGS AND DISCUSSION

Regression Test
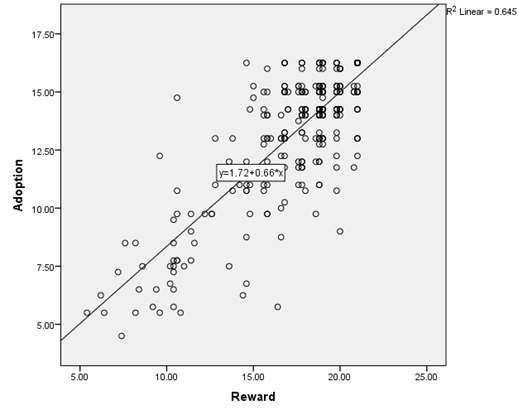
Scatter Plot Graph: Relationship between Reward and Consumer’s Adoption of Cashless Payment
The figure above shows that the relationship between reward and consumer’s adoption to e-payment has been investigated. The line is moving from bottom left towards the upper right in the graph indicates that there is a positive co-relation between reward and consumer’s adoption of e-payment. It is also revealed that the linear regression is 0.645 with a regression equation of y=1.72+0.66*x
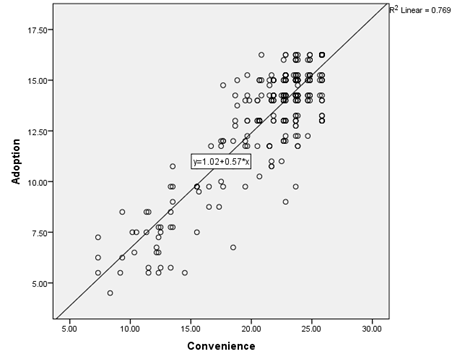
Scatter Plot Graph: Relationship between Convenience and Consumers’ Adoption of Cashless Payment
The figure above shows that the relationship between convenience and consumer’s adoption to e-payment has been investigated. The line is moving from bottom left towards the upper right in the graph indicates that there is a positive co-relation between convenience and consumer’s adoption of e-payment. It is also revealed that the linear regression is 0.769 with a regression equation of y=1.02+0.57*x

Scatter Plot Graph: Relationship between Convenience and Consumers’ Adoption of Cashless Payment
The figure above shows that the relationship between security and consumer’s adoption to e-payment has been investigated. The line is moving from bottom left towards the upper right in the graph indicates that there is a positive co-relation between security and consumer’s adoption of e-payment. It is also revealed that the linear regression is 0.762 with a regression equation of y=1.05+0.72*x
SEM Development Prediction Model
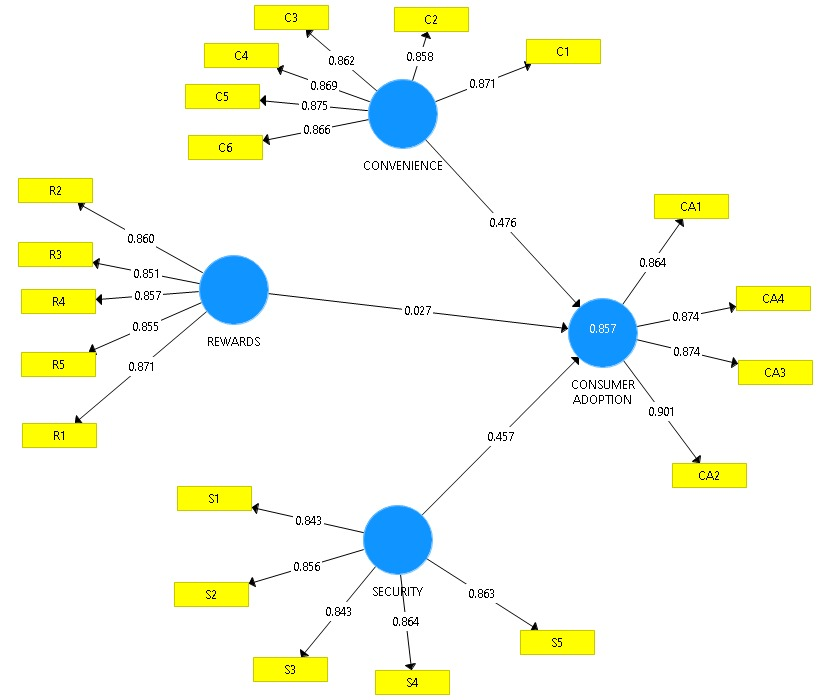
Model Analysis
Firstly, the model was presented with direct path from rewards, convenience and security. All variable links were significant at 0.000 level with the path coefficient of 0.027, 0.476 and 0.457 respectively. Up to this point, no indirect effect was hypothesized or evaluated. Based on Figure 9 above, convenience contributes the highest relationship between the consumer adoption at the value of 0.476. The items inside convenience that contributed the most towards being the highest relationship are C1, C4 and C5. The models had:
1) A direct path from rewards to consumer adoption of cashless payment.
2) A direct path from convenience to consumer adoption of cashless payment.
3) A direct path from security to consumer adoption of cashless payment.


Comments
Post a Comment